The ‘My Emissions’ section of the app will allow you to manage the emission data
for your company, as well as share it with customers that have requested it.
My Page
The company page is the core element in the CBAMBOO platform. Each company on the
system get their own page, which holds the data required by your customers for their
CBAM compliance.
 The page contains information about the company, such as the company name, logo,
website, and the address. It also contains information about the installations
(factories) that a company, and related to those installations, emissions data
for the different goods that the company produces.
The page contains information about the company, such as the company name, logo,
website, and the address. It also contains information about the installations
(factories) that a company, and related to those installations, emissions data
for the different goods that the company produces.
Creating an installation
The first step to generate your emissions data is to create an installation.
The data required to do this is very simple, as you only need to provide the
installation’s name and the address. To do so, click on the ‘Add’ button in the
‘Installations’ table.
 Upon completing the form and clicking on ‘Create’, a new row will be added to
the installations box. A single installation can have one or more emissions reports.
Each emission report covers a certain period of time, which will normally be a
calendar year.
Upon completing the form and clicking on ‘Create’, a new row will be added to
the installations box. A single installation can have one or more emissions reports.
Each emission report covers a certain period of time, which will normally be a
calendar year.
Creating an emissions report
Create a new emissions report by clicking on the ‘Add’ button next to the ‘Reports’
header next to the relevant installation.
 This is again a very simple form where the reporting period must be entered. This
reporting period refers to the period of time over which the installation monitored
its emissions. It will usually be a calendar year. In this box, simply enter the
date range that is covered. Finally, click on ‘Create’.
This creates a new row in the Reports table indicating the date range that is covered
by this emissions report.
This is again a very simple form where the reporting period must be entered. This
reporting period refers to the period of time over which the installation monitored
its emissions. It will usually be a calendar year. In this box, simply enter the
date range that is covered. Finally, click on ‘Create’.
This creates a new row in the Reports table indicating the date range that is covered
by this emissions report.
Creating an emissions report version
Each emission report might have more than one version. This is to be able to track
multiple iterations of the same file, in the situation where you update the data
that you have used for your emissions monitoring.
To create a new version, click on the ‘Edit’ button next to date range of the
relevant report. If this is the first version, then the list of versions will be empty.
To add a new version, open the dropdown that says ‘Add a new version’ by clicking
on it. This menu provides two options of calculating data, Carbon Flow,
which is the recommended tool. Alternatively, if you have already calculated your
emission data via the Excel spreadsheet or a different type of file, you can use
that file instead. Both processes are outlined below.
Carbon Flow
Carbon Flow is tool specially created by CBAMBOO to make the process of monitoring
your emissions much easier. It uses the concept of a process flow diagram to map out
the processes at your installation, and it calculates your emissions using the same
methodology as the European Commission’s Excel template does.
For guidance on using Carbon Flow, go to the documentation section on this tool.
Uploading a file
If you decide to use the Excel template or an alternative file, you need to follow the steps that are
shown on the second option to load and process the emission data.
If you decide to upload a file rather than using Carbon Flow, then your
emissions data will not be linked to your suppliers’. This means that you will
have to manually update your emissions calculations if you receive new data
from your supply chain.

If your emission data is based on the Excel sheet created by the European
Commission, then the system will automatically extract the relevant data
points from it. If it’s a different type of file (e.g. a PDF) then you will
need to manually enter the data into the relevant fields.
 In this example, the data for ‘Electricity consumed’ is missing from the Excel sheet,
as highlighted by the red surrounding box. The user can then manually type in the
correct number assuming that it has been provided by the supplier through a different method.
Once the data is complete, click on ‘Confirm good’, which will close the detail and,
if all the data is complete, then the status circles will both go green.
In this example, the data for ‘Electricity consumed’ is missing from the Excel sheet,
as highlighted by the red surrounding box. The user can then manually type in the
correct number assuming that it has been provided by the supplier through a different method.
Once the data is complete, click on ‘Confirm good’, which will close the detail and,
if all the data is complete, then the status circles will both go green.
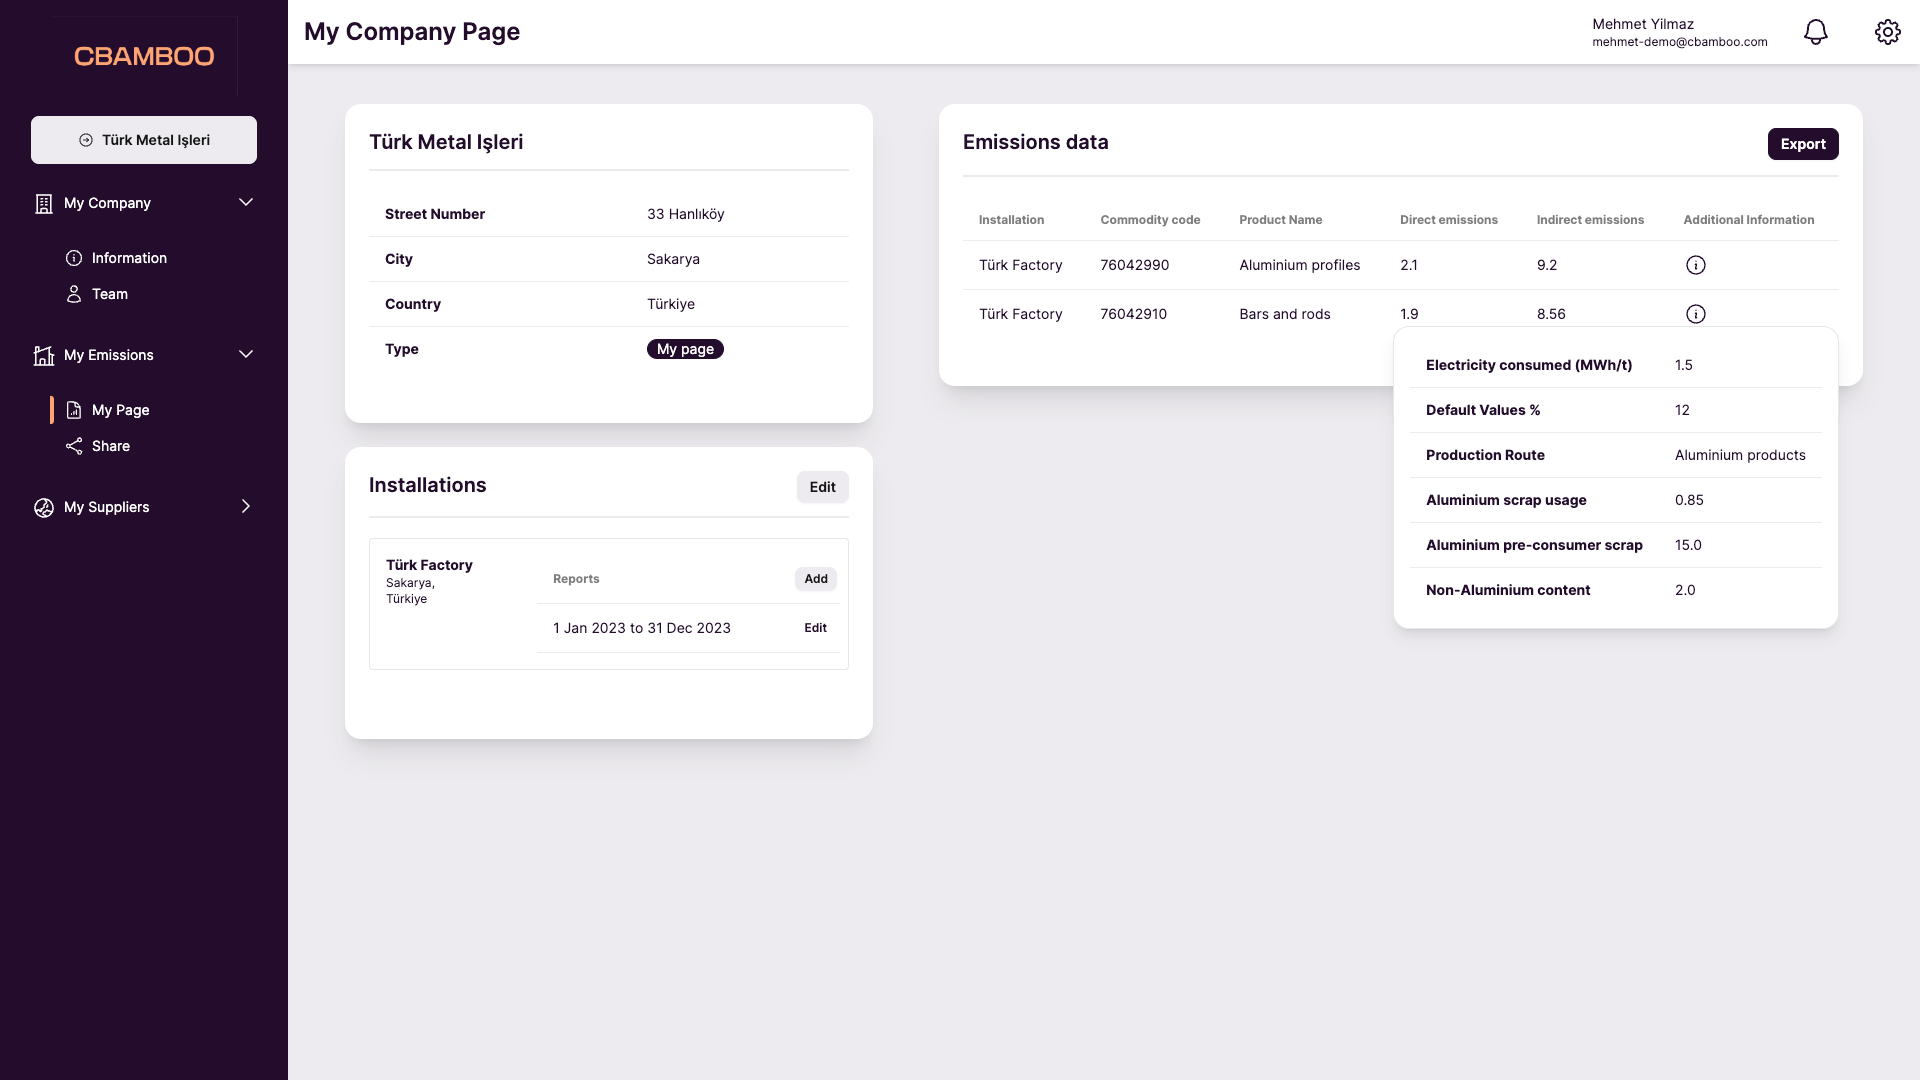
 Confirming the data
When the data for the items is complete, click on ‘Submit. This will create a new
version of the emissions report, which will be added to the table on the sidebar. It will
also add the data to the ‘Emissions Data’ table. By default, it shows the specific embedded
emission values and the commodity code, but you can hover over the ‘information’ icon to see
the additional detail.
Confirming the data
When the data for the items is complete, click on ‘Submit. This will create a new
version of the emissions report, which will be added to the table on the sidebar. It will
also add the data to the ‘Emissions Data’ table. By default, it shows the specific embedded
emission values and the commodity code, but you can hover over the ‘information’ icon to see
the additional detail.